Run a Multi-Dataset report
Multi-Dataset reports allow for the presentation of data from multiple datasets, where each dataset draws data from a separately-specified hierarchy version, and documents are selected based on a specified Revision tag and Scenario tag.
To run a report based on a 'Document Multi-Dataset Report' report template, follow these steps.
Open the Document Multi-Dataset Report Settings tab
Go to the Reporting workspace and click the 'New' text part of the New
button  in
the Home tab on the ribbon.
In the drop-down menu select Document Multi-Dataset Report.
in
the Home tab on the ribbon.
In the drop-down menu select Document Multi-Dataset Report.
Select the hierarchy version and the nodes for reporting
Select the version of the hierarchy to be used from the drop-down list above the hierarchy.
You can report on multiple nodes of the hierarchy, with all or some of the child nodes included. You can manually select nodes to include by browsing the hierarchy and checking the boxes next to the node names.
Or, click a hierarchy node and use the Select button  and the De-select button
 on the ribbon. If you
click the icon part of the button, you select/deselect just that node. If you click the arrow under the button, you can choose
one of these options:
on the ribbon. If you
click the icon part of the button, you select/deselect just that node. If you click the arrow under the button, you can choose
one of these options:
- Select/Deselect Node selects/deselects the selected node.
- Select/Deselect Node and Children selects/deselects the selected node and all the nodes underneath it.
- Select/Deselect Children selects/deselects all nodes under the selected node but not that node itself.
Select the report template
To select a report template which will be used to generate the report, click the Select Report button
on the ribbon
(or click the button in the empty
Reports panel in the middle of the screen). The list of available templates will be displayed in a pop-up window.
Select a template and click
OK to close the dialog.
To remove the selected template, click its remove button
 at the right-hand side.
To replace the selected report template, click the Select Report button
again.
Report Settings
Fill-in the settings for report generation in the Report Settings panel. See Report Settings.
Note: Report names are set automatically and cannot be edited; they are formed from the template name and a datetime string ('YYYYMMDDHHMMSS') that is set when the Run Report job is submitted.
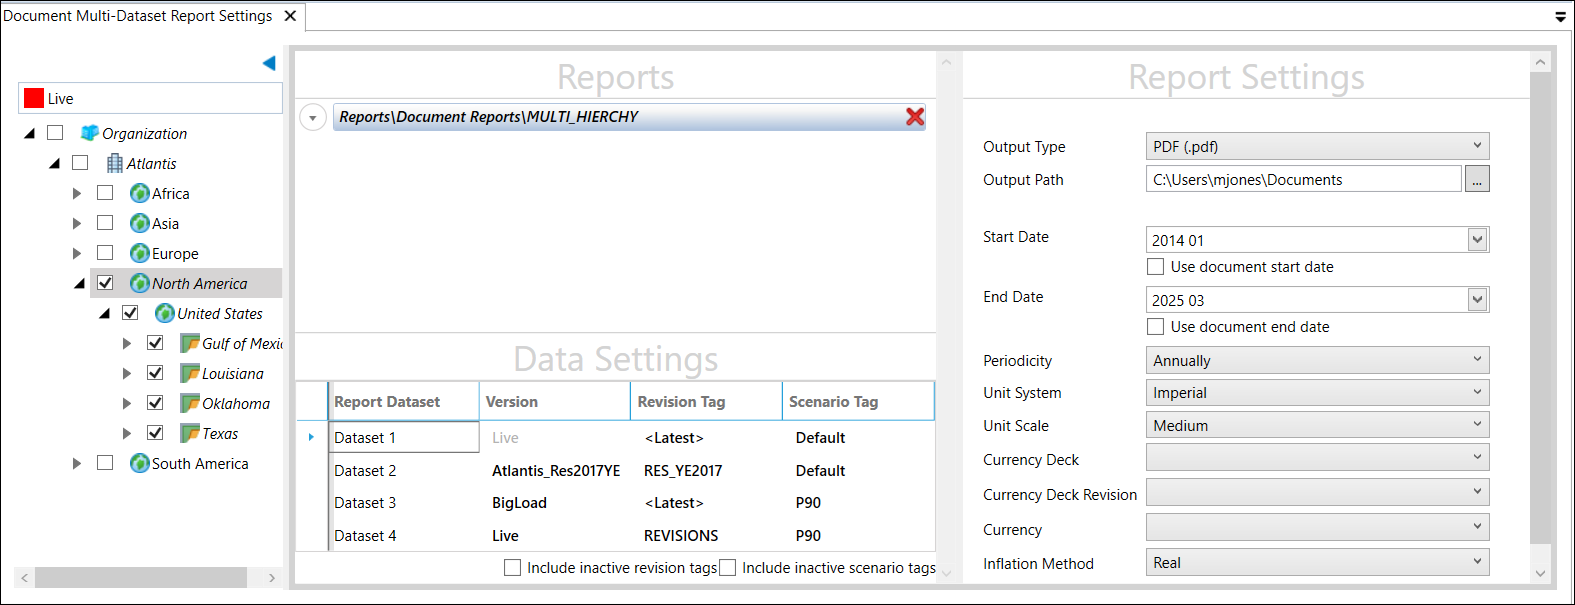
Data Settings
The selection of nodes in the Hierarchy panel drives the creation of a list of DocumentIDs; then each DocumentID variable from that list is used to match documents when creating datasets. All documents in the main dataset will be included in the report because they exist in the main hierarchy. The same list of DocumentIDs will be used to extract documents for all of the other datasets. If a document does not exist in one of the other datasets, the corresponding variable data will be blank.
Your datasets are listed in the Data Settings section of the Reports panel (the number of datasets is determined by the template design). You can now extract data from different versions, revisions and scenarios to populate the datasets by selecting versions and tags from the drop-downs in this section. Use the checkboxes to include inactive revision tags and/or inactive scenario tags.
Run the report generation
Click the Run Reports button  on the ribbon to start the generation of the report(s). The button
will be grayed out if any of the setup steps above are not completed.
on the ribbon to start the generation of the report(s). The button
will be grayed out if any of the setup steps above are not completed.
Report generation jobs are run on the IPS Server, thus you can submit multiple report jobs to run automatically, and track their progress later. Each job will be processsed as a number of tasks, which can be monitored using the task notification area at the bottom of the screen (see task notification area). When a report is completed, you will see an orange pop-up bubble as shown below:

To view task progress, click in the progress bar in the task notification area which will show a list of completed, running and queued tasks. Completed report generation tasks will be displayed with a blue (successful) or red (error) progress bar. Click the down-arrow button next to a job item to open the menu:

- Open opens the report in Planning Space (if it is PRNX format), or using the appropriate default application in your computer, if an application is available (see Output types).
- Browse Folder opens a File Explorer in the folder where the report has been saved.
- Show Log shows log information about the report generation (this log can't be viewed while the job is running).
If you close your current Planning Space session while some reporting jobs are still running, these become 'background' server jobs that will run and finish independent of your client. When you login the next time you can use the Retrieve Reports button to check the IPS Server for any background reporting jobs that were left running when the previous session ended, and you can retrieve completed reports and log information from those jobs (see Background reporting jobs).